Why do we need to collect information?
Example teacher script:
If the school wanted to know if they needed to build more bike racks so that students could store their bikes during the day, they would need to know if enough students would use the racks to determine if it was necessary to provide more. To do so, the school would have to ask each individual student how they get to school and figure out if there was more students riding their bikes to school than there had previously been. Once the information was gathered it could be analysed and if required, the new bike rack would be built. This is an example of collecting and recording data. We collect and record data for a number of different reasons. Can you think of any other data that we may collect about the people in your classroom?
Students move to a Think, Pair, Share activity.
Teacher selects students to share their findings
Students individually record some of the answers in their project book.
Ways to collect data
| digital_technologies.pptx |
Example Teacher Script:
Last year we talked about types of digital systems and what they can do. We discussed how digital systems are made up of hardware and software components. This PowerPoint shows some examples of digital systems. As a class we are going to brainstorm which type of components (that is, software or hardware) these are and complete the Venn Diagram on the whiteboard together. (Complete activity)
Does anybody remember what digital systems can help you to do? (Teacher prompts responses if necessary with scaffolded clues). That's right - digital systems help you to organise data that you have collected, display the data creatively and make meaning from data.
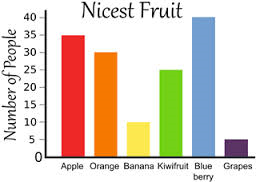
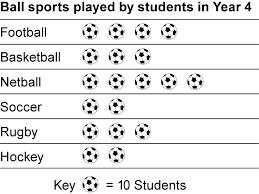
It can be quite easy to collect data, it is simply a case of asking people questions. However, once we have collected the data, we need to be able to represent this data in some way. This is when we must think carefully and decide how we will go about representing it. There are a number of ways this can be done but one particular way we are going to look at is through creating graphs. Let's look at our PowerPoint to see how computers make representing data easier. (Work through PowerPoint with students). As you can see there are many types of graphs, but some of the ones we are going to look at in future lessons are bar graphs, picture graphs and histograms.
Last year we talked about types of digital systems and what they can do. We discussed how digital systems are made up of hardware and software components. This PowerPoint shows some examples of digital systems. As a class we are going to brainstorm which type of components (that is, software or hardware) these are and complete the Venn Diagram on the whiteboard together. (Complete activity)
Does anybody remember what digital systems can help you to do? (Teacher prompts responses if necessary with scaffolded clues). That's right - digital systems help you to organise data that you have collected, display the data creatively and make meaning from data.
It can be quite easy to collect data, it is simply a case of asking people questions. However, once we have collected the data, we need to be able to represent this data in some way. This is when we must think carefully and decide how we will go about representing it. There are a number of ways this can be done but one particular way we are going to look at is through creating graphs. Let's look at our PowerPoint to see how computers make representing data easier. (Work through PowerPoint with students). As you can see there are many types of graphs, but some of the ones we are going to look at in future lessons are bar graphs, picture graphs and histograms.
|
| ||
Activity
As a beginning activity I will introduce you to the concept of gathering information and recording data. Here is a sheet below which we will use to document how students in the class come to school. The graph has information about walking, getting dropped off by car, catching the bus or riding a bike. Move around to each student in the class and ask them which way they come to school. Once you get an answer, simply put a mark or a line into the corresponding section of the graph. Once you are done, compare your information with others.
| how_do_you_get_to_school.docx |
You have just completed a graph. We are now going to look further at how to create graphs.
